Year 30: Q2 Review

What gets measured gets managed.

— Peter Drucker

Overview

Quarterly reviews are designed for me to take a moment to reflect on the past three months. I review the data that I collected from my sleep, morning routine, daily questions, health, and productivity to identify trends or insights. The awareness that I gain from reviewing the data allows me to make meaningful changes in my life.

So often we spend so much time “doing” that we gloss over a critical part of personal growth – review and reflection. This is my attempt to build in some reflection time so I can make the next quarter even more productive and fulfilling.

Sleep

Tracker: Fitbit

Sleep is the lead domino for my productivity during the day. Without proper sleep, it is difficult to stay focused throughout the work day and have enough energy for friends and loved ones at the end of the day.

I use my Fitbit Charge HR to track my sleep. While I didn’t track my sleep while I was on vacation in March/April, I collected enough data to pull some interesting insights. The two major components I’ll analyze from my sleep is time (quantity) and efficiency (quality).

Sleep Time

Sleep Time (Q2-17)

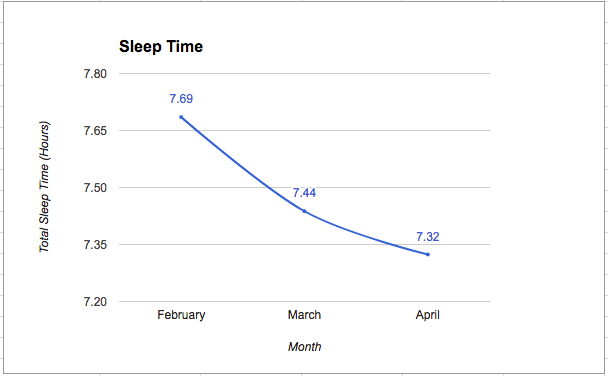
Q1 average: 7.96 hours

Q2 average: 7.48 hours (-6.03% vs. Q1 average)

As the chart above shows, my sleep time fell across all three months of Q2. The Q1 average sleep time of 7.96, compared to the Q2 average of 7.48, equates to 0.48 hours less sleep which equates to about 29 minutes less sleep on average.

There are a lot of factors that contribute to sleep time but I think there were two major factors from Q2. First, starting in mid-April I began to wake-up between 5 a.m. and 6 a.m. to accommodate more time for my morning routine. Second, it’s possible that when daylight savings time shifted here in Toronto in mid-March, the greater amount of sunlight contributed to my body needing less sleep. I generally notice during the summer months that I don’t need to sleep as much.

Sleep Efficiency

Sleep efficiency = (100*Total Sleep Time)/(Total Sleep Time + Time Awake)

Sleep Efficiency (Q2-30)

Q1 baseline: 95.52

February: 95.56 (+4 points vs. Q1 baseline)

March: 96.10 (+58 points vs. Q1 baseline)

April: 96.35 (+83 points vs. Q1 baseline)

Sleep efficiency took a significant leap in March and April. Compared to the baseline from Q1, March and April saw a 58 point and 83 point improvement, respectively.

While there’s a myriad of possible reasons for this improvement, one potential factor is the magnesium supplementation I started in early March. One study that examined the impact between magnesium and sleep quality showed a very high correlation between magnesium supplementation and increased sleep quality. It’s likely that I was somewhat deficient in magnesium and the supplementation of 450mg of magnesium citrate made a big difference in my sleep quality.

Important note: I’m not a doctor and I don’t play one on the internet so please make sure to check with your physician to see if magnesium supplementation is right for you.

So far in Q3, I’ve seen this trend continue along with the same supplementation amount which suggests that it’s a sustainable change for my body. However, I’ll be monitoring carefully on how I feel in the morning to see if my body can sustain this level of sleep time and sleep efficiency.

Morning Routine

Tracker: Google Sheets

My Q2 morning routine consisted of meditation, journaling, a quick workout, reading, and researching & writing for my blog. Below are the daily completion rates over Q2.

Morning Routine (Q2-17)

Aside from meditation, it’s pretty clear that my Q2 morning routine took a hit. Across the board, most of my habits decreased significantly in their completion rates. Particularly troubling is the reading habit that was down by 40% as reading is a critical component of my personal and professional growth.

There’s probably a couple of factors here that contributed to the dip in Q2. First, in March, I was pretty busy preparing for the trip to Japan and wrapping up my work in time. That likely contributed to the significant dip in my morning routine being completed. Second, after a really strong start to the year in January, my consistency took a hit in February and really cratered in March. That’s the thing about these types of routines: it’s not how strong you start – it’s how consistent you can be across a long period of time.

It makes me realize the importance of mixing things up in my morning and keeping things fun. I think that’s why April was such a big bounce-back month. I hadn’t been doing my morning routine for almost 3 weeks and it was fun to get back into it. I need to think about incorporating strategic routine breaks in the middle of each quarter so I can come back feeling refreshed to go back to my routine.

Daily Questions

Tracker: Google Sheets

Daily Questions are five questions I ask myself at the end of the day to gauge the effort I put into my key priorities. I came across this idea in the book Triggers by Marshall Goldsmith which I highly recommend reading.

I rate myself on a scale of 1 to 4 on how much of an effort I put into fulfilling each question. The objective of the questions is to measure my effort (i.e. input) rather than the outcomes (i.e. output) because my effort is something I control. When I know I put in the investment and time into fulfilling each question, I can feel like I did what I can do. As such, each question begins with the phrase “Did I do my best to…?”

Here are the questions that I asked myself everyday over the past quarter:

Did I do my best to…

  1. Make progress towards my objectives at Actionable today?
  2. Invest in my friendships today?
  3. Invest in my relationship with Carly today?
  4. Invest in my physical health today?
  5. Invest in my emotional health today?

Month-by-Month

Daily Questions Monthly Average (Q2-30).png

It’s nice to see a steady rise in the month-by-month average of my daily question scores. A big change that I saw in Q2 was the increase in Question #1, “Did I do my best to make progress towards my objectives at Actionable today?”

Ever since I picked up the Productivity Planner by Intelligent Change it’s been a game-changer for me when it comes to my work productivity. The structure and process of the planner make it really easy to set my daily goals and track my progress. They’ve also done a great job of outlining the weekly reviews which make it easy to recalibrate projects for the following week. Honestly, I can’t go without it now and it’s a big reason Question #1 has significantly improved in Q2.

Question-by-Question

Daily Questions (Q2-30)

One area that I’d like to focus more closely in the coming months is Question #2 – “Did I do my best to invest in my friendships today?” I really enjoy company with friends but I also really enjoy my alone time. It’s an area that I could use some help finding the right balance. It could mean more catch ups over the phone instead of going out. It’s worth exploring because friendships are a priority in my life.
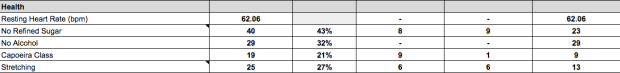
Health

Tracker: Fitbit & Google Sheets

The Health section of my Quarterly Review is still a work in progress. At the moment, I’m collecting data on my average resting heart rate (RHR) and the number of capoeira classes I go to every month.

According to the National Institute of Health, the average resting heart rate (RHR) for adults is 60-100 beats per minute. For well-trained athletes, that range falls between 40-60 beats per minute. A lower RHR generally means that your heart is able to pump more blood with each beat with greater efficiency and is a sign of good health.

That’s one of the reasons why I’m using my Fitbit to track my RHR. By taking a look at my RHR on a monthly basis, I might be able to spot any potential issues that might be happening to my body early on.

Resting Heart Rate (bpm)

Resting Heart Rate (Q2-30)

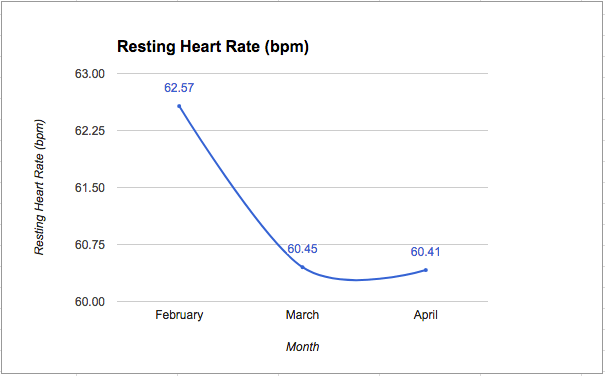
I’m not exactly sure why my heart rate dropped by over 2 beats per minute between February and March. It could be because of an increase in my fitness level or perhaps the better quality of sleep I started having in March. I’ve seen the average resting heart rate continue at the 60 bpm level into Q3 which suggests this is a sustainable change.

Another significant component of my physical health comes from practicing capoeira on a weekly basis. Below shows how many capoeira classes I attended in Q2.

Capoeira Classes

Capoeira Classes (Q2-30)

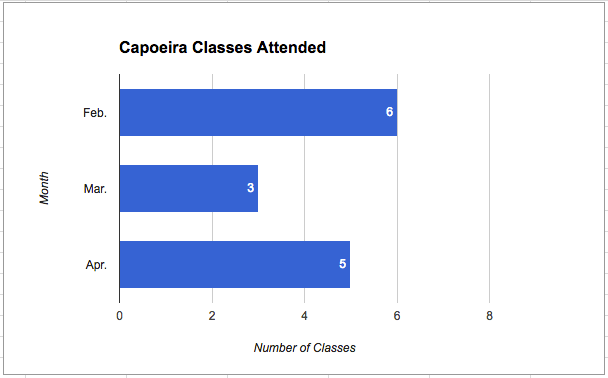
Q2 wasn’t exactly where I wanted to get my capoeira class attendance level to. My objective is to make it to a minimum of 8 classes per month which is a goal I fell short of each month. That being said, being away for a few weeks in March and April definitely threw my rhythm off a little bit. And momentum matters in something like capoeira where techniques learned in one class need to be practiced in subsequent classes to be learned and perfected.

Productivity

Tracker: RescueTime

I collect my productivity data with RescueTime (RT). RT tracks my daily online and offline activity and categorizes them on a scale of very distracting to neutral to very productive. It also calculates a Productivity Pulse that indicates how productive my day was based on the ratio of productive hours to total hours worked.

Productivity Pulse (Q2-17)
A quick caveat here. Due to a change in the categorization of one of my activities in RT, the April figures look to have shifted significantly. The actual Pulse for April is likely closer to 80.

Q1 baseline: 77.7

February: 79.0 (+1.67%)

March: 78.1 (+0.51%)

April: 87.1 (+12.10%)

As you can see, there were improvements across Q2 with my Productivity Pulse. February and March were both fairly consistent while April saw a significant increase. This was in part due to a change in the categorization of productive activity in RT. As you can see in the Productive Time vs. Total Time Logged below, the Productive Time for April increased by 0.7 hours compared to February and March.

Productive vs. Total (Q2-17)

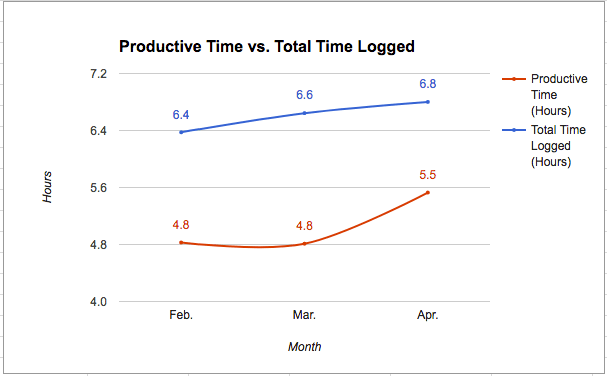
The difference between Total Time Logged and Productive Time is very interesting. In an ideal world, the entire workday is “productive” but it’s a big challenge to maintain focus throughout the day. So seeing this gap helps me see how productive my day really is and areas that I can potentially improve.

For example, what do I do for the average of 1.3 hours a day that aren’t classified as Productive Time? How can I better understand my habits and unconscious routines so I can reduce that gap? Do I generally “max out” at ~5 hours of “productive time” each day?

Although I may work an average of 6.2 hours per day, my productive time is 4.57 hours per day. That means that there are certain activities or hours that really drive the productivity of my day. So making sure I take advantage of that time is crucial in making sure I get the most out of my day.

In Q2, I’ve been experimenting with a new tool called The Productivity Planner that helps me map out the most important task to get done everyday and use the Pomodoro Method to get it done. It’s already paid big dividends for me and I’m excited to see what the aggregate impact for Q2 will look like.

Learnings from Q2

All in all, here were some of my key learnings from Q2 that I plan to apply in Q3.

General

  • Begin to craft out a strategy for improving and expanding this blog to reach more people.
  • Continue to track consistently in Q3. Leverage the law of large numbers to identify baselines and trends.

Sleep

  • Continue to supplement my diet with 450mg of magnesium citrate to ensure higher sleep quality.
  • Adjust my sleep schedule to fit my chronotype. Based on data collected over the past 6 months, my body naturally goes to sleep around 10:40 – 11 p.m. and wakes up around 6:30 – 7:00 a.m.

Morning Routine

  • Find ways to keep my morning routine fresh. Add a different exercise to my morning workout, try a different type of coffee, switch up the order of the routine, etc.
  • Plan out a strategic break (e.g. a weekend away) from the morning routine in the middle of the next quarter.
  • Experiment with a morning routine that matches my sleep chronotype. Start the day with a quick workout and cool shower.
  • Don’t put so much pressure on my morning routine. Consider cutting it down a little bit and shifting some aspects to other parts of the day.

Daily Questions

  • Experiment with a different time for my research/writing for my blog. Evening writing could work out better.

Health

  • Create a strategy to make it to 8 capoeira classes each month and make that my baseline.
  • Visit my Family Doctor to do my yearly physical.
  • Visit a Naturopathic Doctor to gather more data about my health.
  • Invest in a smart scale to track data such as weight, body mass index, lean mass, and body fat percentage.

Productivity

  • Ensure I still hit at least 7.5 hours of sleep each night. Even with a higher sleep efficiency, 7.5 hours is what my body still seems to need.
  • Continue to use the Productivity Planner to prioritize my most important tasks each day.

Year 30: Q1 Review

Quarterly reviews are my attempt to take a moment to stop and reflect on the past three months. I’ll review the data that I collected from my sleep, morning routine, daily questions, health, and productivity to see if there are any trends that emerge.

We spend so much of our lives “doing” and spend so little on reflection. Imagine a sports team that loses a game and spends only a couple minutes looking at the game tape. Imagine an architect that sees her masterpiece come to life but doesn’t spend time reflecting on what went well, what she would do differently next time, etc.

This is my attempt to build in a little bit of reflection so I can make the next quarter even more productive and valuable. The reason why I chose a boat in open water is because the quarterly reviews are a perfect opportunity to see how far we’ve come and where we want to navigate to next.

One quick caveat to this quarterly review. Some of the data – specifically around sleep – had only been collected for January so it doesn’t fully reflect the entire quarter. I’ll point that out along the way.

Sleep

Screen_Shot_2017-02-19_at_4_02_08_PM.png

The data above only reflects my January statistics since I was collecting this data in November and December.

I’m particularly proud of my weekday average wake-up time. Since the start of the year I’ve been focused on getting up at 6:00 AM. Last year, I experimented with waking up whenever I naturally woke up and found that I often slept more than I really needed to. While I can’t say waking up at 6:00 AM has me jumping out of bed, I feel good being able to get through my morning routine before I get started with work around 9:00 AM.

I’m sure I can continue to tweak this sleep schedule. Particularly as I learn more about the science of sleep and discover what works best for my particular chronotype. (I’m a “bear” chronotype).

Morning Routine

screen_shot_2017-02-19_at_4_02_08_pm

November and December were rough months for me when it came to my morning routine. The success rate for all of these habits would be closer to 50% if I didn’t have a very strong January. The activity that had the lowest success rate was Research/Writing. Morning is a difficult time for me to focus on writing or researching for my blog. With only 15-minute windows for each activity, it’s hard to really get anything meaningful done in that time. So it may be worth re-considering when I focus on this habit. Perhaps a 25-minute time period (i.e. a pomodoro) in the evening might be better? Something worth considering.

On the other hand, Workout was my most successful morning habit. Since January my morning workout has consisted of 25 kettlebell swings. It’s a decent workout but there’s probably some more that I can do. I know I can experiment with more swings or maybe upgrade to a heavier kettlebell. Something to keep an eye on as a very high success rate might be an indicator that the habit is too easy for me to do.

For the next quarter, I’d like to push the success rate for all of these activities to above 70%. With a goal at that rate I can see better trends on what activities need a little bit more tweaking or overhauling altogether.

Daily Questions

screen_shot_2017-02-19_at_4_19_56_pm

The Daily Questions are a concept I’ve borrowed from Marshall Goldsmith. The concept is simple – ask yourself a number questions to see if you gave your best effort in accomplishing your priorities. All the questions start with the phrase “Did I do my best to…” The scores above are between 1 to 4 with 4 being the highest score.

It’s a little difficult to read too much into these questions here as some of them I didn’t start tracking until January and I also tweaked a little with the definition of success with some of these. But what it is helpful for is to see some trends in January.

As you can see, investing in my physical and emotional health ranked highly in January while investing in my friendships and relationship with my girlfriend were 2-3 points lower. I don’t want to make too much of this as it’s still early days but it may require more effort in investing time into my relationships.

Am I spending more time on my work or personal growth over relationships? That’s possible since the relative score for those are a little higher. But, it could also mean that my scoring criteria for “investing” in my relationships is higher. It might mean I need to establish better criteria on what a 4 out 4 day looks like for building friendships or developing my relationship with Carly. The other challenge here too is that everyday isn’t going to be a “home run” day so how do I account for those other days when I’m just going about my business as usual?

I don’t have the answers to these at the moment but just something to start thinking about…

Health

Screen_Shot_2017-02-19_at_4_19_56_P1M.png

These are some completely new stats that I started tracking last quarter and I’m really excited about it. In particular, I’m excited to dig deeper into my resting heart rate (beats per minute) data. Overall, my resting heart rate was 62.06.

A normal resting heart rate for adults is between 60 to 100 bpm. If you’re an athlete, you may even have a resting heart rate closer to 40 bpm. Either way, I’m happy with where I’m at. I would like to aim for a sub 60 bpm as I continue to improve my fitness with my capoeira classes and refined morning workout routine.

The really interesting part is when I eat poorly or I drink alcohol, I notice that my resting heart rate jumps 2-3 bpm. Ever more reason for me to stay away from refined sugar and alcohol on a regular basis.

The other focus I have within my health goals is to improve my capoeira skills and flexibility. From years of ignoring stretching (and likely genetics) my body has become extremely stiff. So practicing capoeira helps out significantly but I also need to add on a layer stretching on my own time to see real improvements. My goal is within the next 3-5 years to be able to do a full split. It’s a distant, distant, distant dream right now but you’ve got to start somewhere, right?

Productivity

Screen_Shot_2017-02-19_at_4_19_526_PM.png

This is one of the categories that I think is really helpful. The data comes from RescueTime which is an application that collects data from my online and offline activities. With so much data pouring through everyday it gives me a good idea on what my productivity baselines are.

My average Productivity Pulse is around 77. So anything over that in a workday is good to aim for. The difference between Total Work Time and Productive Time is interesting too. Although I may work an average of 6.2 hours per day, my productive time is 4.57 hours per day. That means that there are certain activities or hours that really drive the productivity of my day. So making sure I take advantage of that time is crucial in making sure I get the most out of my day.

In Q2, I’ve been experimenting with a new tool called The Productivity Planner that helps me map out the most important task to get done everyday and use the Pomodoro Method to get it done. It’s already paid big dividends for me and I’m excited to see what the aggregate impact for Q2 will look like.

Learnings from Q1

  1. Continue to track consistently in Q2. Leverage the law of large numbers to identify baselines and trends.
  2. Monitor my 6:00 AM wake-up routine closely. See if I continue to get the best version out of myself with an early wake-up time.
  3. Experiment with a different time for my research/writing for my blog. Evening writing could work out better.
  4. Think about what a 4 out of 4 day looks like for investing in my friendships and relationship with Carly. What about days when nothing “special” happens?
  5. Look closer at my productivity time on RescueTime. Do the criterias look good? Should they be updated based on my activity?

To-do list for Q2

  1. Continue to implement the Productivity Planner for better strategizing and planning my workdays.
  2. Create a criteria for what a 4 out of 4 day looks like for each of the Daily Questions.

My Personal Goal Buckets for Year 30.

In an upcoming most, I’ll be sharing the process that I used to create my personal goals in my 30th year. But for now, below are my main goal “buckets” where my time this year will be focused on. More context to come!

Bucket 1: Develop better, tighter friendships.

Q1: Organize a Gentlemen’s Dinner two out of the three months of the quarter.

Bucket 2: Make all-around improvements in capoeira with a focus on strength and flexibility.

Q1: Attend two classes per week and incorporate a Saturday 1 p.m. class into my schedule.

Q1: Stretch 10 minutes each evening for 33% of the quarter.

Bucket 3: Deepen my relationship with Carly by being present with her and helping her achieve her goals.

Q1: Plan out the rest of our trip to Japan in March/April.

Q1: Enjoy and be present throughout the Japan Trip experience with Carly.

Bucket 4: Explore my psychology and address my emotional triggers.

Q1: Read Tim Laurence’s book on the Hoffman Process.

Q1: Begin to craft a “WHY” post for my blog outlining my mission statement.

Bucket 5: Help Actionable reach financial stability and deepen my impact on the organization and its people.

Bucket 6: Continue to save 15% of my income for future financial flexibility.

Q1: Structure my savings like this – 5% for retirement, 10% for down payment savings, and 5% for an emergency fund.

Bucket 7: Invest in my health by following the Bulletproof/Slow-Carb diet and make cooking fun by developing my culinary knowledge.

Q1: Schedule a consultation with a functional health practitioner.

Q1: Complete up to Lesson 12 in the DOM section in the 4-Hour Chef.

My Quarterly Habits Review (Q2, 2016)

This year I’ve started a new tradition to take a look at the habits I’ve been developing on a quarterly basis. They cover four main areas in my life:

  1. Daily Hustle
  2. Daily Questions
  3. Mindset
  4. Health & Fitness

The data is collected on a daily basis through a variety of different tools. You can check out last quarter’s review here.

Daily Hustle

The Daily Hustle is inspired by the Jerry Seinfeld’s productivity method to work on one key habit on a daily basis. The goal is to keep the habit going by not breaking the chain of X’s on a calendar. It’s the ONE Thing that can help make your day a success and push you towards your goal.

My goal this year has been to spend 15-minutes working on my blog everyday. I use a Hustle Calendar to help me keep track of this keystone habit. Check out where my calendar is current at below and the stats from Q2.

IMG_0128

Success rate: 79% (-5% from Q1)

Posts published: 20 (+4 from Q1)

Observations:

Q2 saw my success rate dip 5% which is not a huge concern. Anything hovering around 80% is a respectable number for me. On the flipside, I did publish 20 posts (marked by the squared dates) compared to 16 in Q1. So from an output level I was techincally more productive this past quarter.

Daily Questions

The Daily Questions are inspired by an activity in Marshall Goldsmith’s book Triggers. It’s an activity that allows me to track my progress on key priorities and objectives. It’s a holistic view on how much effort I put into advancing towards my goals.

Here were the questions I asked this past quarter followed by the key stats and highlights:

  1. Did I do my best to set clear goals today?
  2. Did I do my best to make progress toward my goals today?
  3. Did I do my best to create meaning for myself or others today?
  4. Did I do my best to be happy today?
  5. Did I do my best to build positive relationships today?
  6. Did I do my best to be fully engaged today?
  7. Did I do my best to be physically and emotionally healthy today?
  8. Did I do my best to minimize the number of decisions I made today?
Screen Shot 2016-08-20 at 6.45.15 PM.png
My best month (July)

Monthly Averages:

April – 8.59

May – 8.61

June – 8.70

April’s Highest & Lowest Scores:

Did I do my best to set clear goals today? @ 9.28

Did I do my best to be physically and emotionally healthy today? @ 8.21

May’s Highest & Lowest Scores:

Did I do my best to set clear goals today? @ 9.72

Did I do my best to be happy today? @ 8.14

June’s Highest & Lowest Scores:

Did I do my best to set clear goals today? @ 9.41

Did I do my best to be physically and emotionally healthy today? @8.24

Observations:

There’s no doubt that I’ve hit my stride with the Did I do my best to set clear goals today? question. Using Momentum to help me set my main focus for the day has been a game changer. On the other hand, it’s clear that Did I do my best to be physically and emotionally healthy today? has lagged behind appearing two out of three months as the lowest score. I’ve been consistent with my 7-Minute Workout (as you’ll see below) but my consistency with going to capoeira class has hurt this score. It’s also a slightly ambiguous question as it melds in physical and emotional health together. Both are intertwined but perhaps it may be best to distinguish between the two for future months.

Mindset

The mindset habit I’m developing is spending 10-15 minutes every day meditating. I’m currently using an application called Calm to help me with this.

IMG_0167
My best month (July)

Completion Rate: 87% (+12% from Q1)

Best Month: Tied – April and June @ 90% completion

Longest Streak: 42 days (from March to April)

Observations:

Q2 was a fantastic quarter for meditation. My completion rate jumped by 12% between Q1 and Q2 and I developed a very consistent meditation habit. This was despite a fairly travel heavy quarter for me. I’m proud of the way that I stayed disciplined in keeping my morning routine going. I was also much more consistent with my meditation journal which has become a key addition to my post-meditation routine. Putting down my thoughts from the meditation and assessing my focus has added another layer of awareness.

As I improve my ability to focus through my meditation and find a calm mindset faster, the next step for me is to deepen that focus and learn more about myself through this process. I’m excited about the learnings and challenges that’ll come from the next quarter.

Health & Fitness

Last but not least, the health habit I’m developing is completing a 7-Minute Workout everyday through the Seven app. The rule with the 7-Minute Workout is not to miss more than 2 workouts every month. The workouts are 7 minute high intensity interval trainining (HIIT) style so they get pretty intense.

IMG_0168
My best month (July)

Completion Rate: 92% (-1% from Q1)

Best Month: May @ 94% completion

Observations:

In Q2, I focused mainly on the Push-Up Pusher program which focused on a variety of push-up styles. It was (and still is) a challenging workout for me but I did see improvements specifically with my shoulders and my triceps. It’s one that I’m interested in continuing to work on and improve upon especially because my upper body is weaker than my lower body.

Conclusion

Q2 was a great continuation of the habits I began to develop in Q1. I’m really happy with my results overall and the steady development of habits. I’m also finding a lot of value in doing this review as I get a chance to look at areas of improvement and implement those for Q3 and Q4. It’s crazy how quickly time flies so taking a moment to reflect is really important. More to come next quarter!

Peter’s Quarterly Review – Q1 2016

Recently, I read a post on Leo Babauta’s Zen Habits blog about Monthly Reviews. At the beginning of every month, Leo asks himself a set of questions to reflect on the month before. I think it’s a great idea which inspired me to start doing a quarterly review (baby steps, right?)

I’ve been spending a lot of time over the past several months quantifying my life. I have a calendar that tracks my daily goals, an app that tracks my meditation, a spreadsheet that tracks my daily behaviour, and so on. Having the data is a great starting point because it’s an objective look at where you stand. As Peter Drucker once famously said, “What gets measured gets managed.” I’m hoping to bring a bit of measurement into my life through this process.

Here’s what I want to review with this first attempt:

Daily Goal

Daily Questions

Mindset

Health & Fitness

So this might be a little messy as it’s my first attempt but let’s try to breakdown how my quarter went. The objective here is to break down my tracking tools and see if I can create a template to use moving forward.

Daily Goal

IMG_0260

Above is my 2016 Hustle Calendar. The days marked as “X” are days that I completed my 2016 goal – spend 15 minutes working on my blog everyday. I’m hoping that a small contribution everyday to my blog will result in big results by the end of 365 days.

My blog is not intended to make money or sell people stuff; it’s simply a platform to share my knowledge and I don’t have any specific monetary goals or anything. The focus is to add value to people’s lives while I learn/research things that matter.

You’ll see most days are marked and some are not. I also put a black box around the days that I published a new post. Days with lines running through them are days that I was traveling. It’s quite helpful to see how I was able to maintain (or not maintain) my habits while on the road.

According to my Hustle Calendar (up to March 31st), I hit 76 out of 91 days of the month meaning a 84% success rate. Pretty good for my first quarter building out this habit. Below are some of the stats.

Total days: 91

Completed days: 76

Incomplete days: 15

Success rate: 84%

Longest streak: 15 days

Days travelled: 15

Success rate while traveling: 47% (7 out of 15)

Posts published: 16

Out of the metrics listed above (and I’m sure I can slice and dice this further) the ones I can benchmark myself on moving forward are Success Rate, Longest Streak, and Posts Published. Basically my goal for next month can be to improve upon my Success Rate, put together a streak longer than 15 days, and publish more than 16 posts.

That said, I’m not too concerned about how many posts I published this quarter. As I build up this habit, I’m more concerned about the success rate and the quality of time that I put in for every 15 minute session. The posts and the quality will rise as I do a better job managing my 15 minutes and refining that process.

I also noticed that traveling put a big dent into my stats. I was only successful 47% of the time while on the road meaning I need to re-evaluate how I complete my morning routine during travels to include the 15 minutes of blogging or try to limit the time I spend on the road.

Daily Questions

I’ve written in the past about the 7 Questions to Ask Yourself Everyday. It’s a powerful tool for habit development and improving self awareness. I’ve been asking myself 7 questions every day over the past 3 months and rating myself on a scale of 1 to 10 for each of the questions. It’s given me some insight into which questions I’m doing well with and which ones I still need to work on. This metric is another great point of reference as I look back on the progress that I’ve made so far.

This quarter’s numbers are a little bit off since I was working on the scoring system a little bit and creating some consistency. But here they are anyways:

January

Monthly average = 8.65/10

Highest average scored question (tied):

Did I do my best to make progress towards my goals today? (8.74/10)

Did I do my best to be fully engaged today? (8.74/10)

Lowest average scored question:

Did I do my best to create meaning for myself or others today? (8.53/10)

February

Monthly average = 7.79/10

Highest average scored question:

Did I do my best to set clear goals today? (8.03/10)

Lowest average scored question:

Did I do my best to be physically and emotionally healthy today? (7.52/10)

March

Monthly average = 8.31/10

Highest average scored question:

Did I do my best to set clear goals today? (9.11/10)

Lowest average scored question:

Did I do my best to create meaning for myself or others today? (8.04/10)

There’s a lot of ways that I can look at this data but the one big thing that stuck out to me that I became a lot better at setting clear goals each day. Both February and March were months where that question scored highest. March was incredible with a 9.11 average!

This is due in large part to the 5 minutes I’ve started spending every morning setting my focus for the day. I use an app called Momentum that gives you space to write down your top focus in a new tab. Every time you open a new tab, the Momentum tab shows you what your main focus is until you complete it and cross it off the main page.

Screen Shot 2016-03-29 at 9.03.51 AM

Sometimes my focus is a little bit abstract like the one above but on other days it’s very specific (e.g. “Spend 15 minutes working on my tax return” or “Go to my capoeira class this evening.”) I also set a separate focus of the day for my job which helps keep things separate. Suffice to say, I’ve really enjoyed this morning goal-setting habit and I plan on keeping it up in Q2.

I also noticed a big dip in the February average but I’m going to chalk that up to a shift in my scoring methodology. In January, I was okay with including decimal points in my score but I changed that to no decimal points so I wouldn’t sit on the fence between an 8 or 9 with an 8.5, for example. That adjustment in scoring is what is partially reflecting the scoring.

Mindset

For me, having a good mindset for the day starts with spending 10 minutes meditating every morning. And I’ve been using an app called Calm to help me with this process. One of the aspects that I love about Calm is how it helps you track and view your meditation over the course of a month.

IMG_0264

As you can see above, it shows you your current streak at the top and the days that you meditated are highlighted by a green circle. It even gives you additional stats below and an option at the bottom to add a meditation session manually in case you didn’t use the app for it.

The data from the entire quarter is a little incomplete as I was meditating without using the Calm app in January but here are the stats:

January

31 days

17 days complete

14 days incomplete

55% success

February

29 days

23 days complete

6 days incomplete

79% success

March

31 days

28 days complete

3 days incomplete

90% success

Going from a 55% success rate in January to a 90% success rate was a huge improvement. I’d be happy to hit a 90% success rate any month so the key will be to maintain my progress so far. I’ve noticed that adding a habit to journal a little bit after my meditation has helped make the experience more fulfilling and exciting to come back to. I have a feeling that contributed to a successful March and continued interest in me to meditate everyday.

Health and fitness

The tool I’m using for this is called the 7 Minute Workout. Hands down, it is the best health app I have used to date. The workouts are great and the motion graphics make it easy to understand the workout technique. It also has a built-in “7 Month Challenge” where you try to do a 7-Minute Workout everyday over 7 months without missing 3 workouts in a month. If you miss 3 workouts, then the streak ends and you have to start over.

IMG_0262


I started my 7-Month Challenge back in October and above is a screenshot after Day #171. There were a couple of close calls but I’ve pushed my way through to over 80% completion. Maintaining this streak to 7 months and beyond is an important goal for me. At the moment, I’m working on my upper body with a workout called “Pushup Pusher”. I’ve been pleased with the progress I’ve made with muscle development so far as I’ve been keeping track by taking a weekly snapshot of my upper body.

Conclusion

As you can see above, my quarterly review really consists of how I’m performing with my daily habits. Small changes can make a big difference over time and that’s what I’m counting on here. I’ve been really pleased with my 84% success rate with my daily goal, a 9.11 score for my goal setting habit, 90% meditation success rate in March, and keeping my 7-Month Challenge streak alive.

What I’d like to do for the next quarter is to continue collecting the data and keep my eyes peeled for trends and areas of improvement. This quarter’s review is a good start but I’d like to refine this process further. I’d also like to include another review section for “Progress with Projects” so I can keep track of progress for projects that live outside the scope of my daily habits. Further to that, it would be good to set clear benchmarks for success rates, muscle/weight gain (for my health goals), and new subscribers to my blog so I have specific measurements to strive towards.

Please feel free to add below your thoughts and perhaps your experience with review processes like this. I’d love to continue to improve this and eventually develop a template for you to run through a quarterly review.