
Quarterly reviews are my attempt to take a moment to stop and reflect on the past three months. I’ll review the data that I collected from my sleep, morning routine, daily questions, health, and productivity to see if there are any trends that emerge.
We spend so much of our lives “doing” and spend so little on reflection. Imagine a sports team that loses a game and spends only a couple minutes looking at the game tape. Imagine an architect that sees her masterpiece come to life but doesn’t spend time reflecting on what went well, what she would do differently next time, etc.
This is my attempt to build in a little bit of reflection so I can make the next quarter even more productive and valuable. The reason why I chose a boat in open water is because the quarterly reviews are a perfect opportunity to see how far we’ve come and where we want to navigate to next.
One quick caveat to this quarterly review. Some of the data – specifically around sleep – had only been collected for January so it doesn’t fully reflect the entire quarter. I’ll point that out along the way.
Sleep

The data above only reflects my January statistics since I was collecting this data in November and December.
I’m particularly proud of my weekday average wake-up time. Since the start of the year I’ve been focused on getting up at 6:00 AM. Last year, I experimented with waking up whenever I naturally woke up and found that I often slept more than I really needed to. While I can’t say waking up at 6:00 AM has me jumping out of bed, I feel good being able to get through my morning routine before I get started with work around 9:00 AM.
I’m sure I can continue to tweak this sleep schedule. Particularly as I learn more about the science of sleep and discover what works best for my particular chronotype. (I’m a “bear” chronotype).
Morning Routine

November and December were rough months for me when it came to my morning routine. The success rate for all of these habits would be closer to 50% if I didn’t have a very strong January. The activity that had the lowest success rate was Research/Writing. Morning is a difficult time for me to focus on writing or researching for my blog. With only 15-minute windows for each activity, it’s hard to really get anything meaningful done in that time. So it may be worth re-considering when I focus on this habit. Perhaps a 25-minute time period (i.e. a pomodoro) in the evening might be better? Something worth considering.
On the other hand, Workout was my most successful morning habit. Since January my morning workout has consisted of 25 kettlebell swings. It’s a decent workout but there’s probably some more that I can do. I know I can experiment with more swings or maybe upgrade to a heavier kettlebell. Something to keep an eye on as a very high success rate might be an indicator that the habit is too easy for me to do.
For the next quarter, I’d like to push the success rate for all of these activities to above 70%. With a goal at that rate I can see better trends on what activities need a little bit more tweaking or overhauling altogether.
Daily Questions

The Daily Questions are a concept I’ve borrowed from Marshall Goldsmith. The concept is simple – ask yourself a number questions to see if you gave your best effort in accomplishing your priorities. All the questions start with the phrase “Did I do my best to…” The scores above are between 1 to 4 with 4 being the highest score.
It’s a little difficult to read too much into these questions here as some of them I didn’t start tracking until January and I also tweaked a little with the definition of success with some of these. But what it is helpful for is to see some trends in January.
As you can see, investing in my physical and emotional health ranked highly in January while investing in my friendships and relationship with my girlfriend were 2-3 points lower. I don’t want to make too much of this as it’s still early days but it may require more effort in investing time into my relationships.
Am I spending more time on my work or personal growth over relationships? That’s possible since the relative score for those are a little higher. But, it could also mean that my scoring criteria for “investing” in my relationships is higher. It might mean I need to establish better criteria on what a 4 out 4 day looks like for building friendships or developing my relationship with Carly. The other challenge here too is that everyday isn’t going to be a “home run” day so how do I account for those other days when I’m just going about my business as usual?
I don’t have the answers to these at the moment but just something to start thinking about…
Health
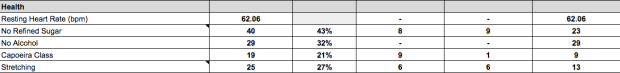
These are some completely new stats that I started tracking last quarter and I’m really excited about it. In particular, I’m excited to dig deeper into my resting heart rate (beats per minute) data. Overall, my resting heart rate was 62.06.
A normal resting heart rate for adults is between 60 to 100 bpm. If you’re an athlete, you may even have a resting heart rate closer to 40 bpm. Either way, I’m happy with where I’m at. I would like to aim for a sub 60 bpm as I continue to improve my fitness with my capoeira classes and refined morning workout routine.
The really interesting part is when I eat poorly or I drink alcohol, I notice that my resting heart rate jumps 2-3 bpm. Ever more reason for me to stay away from refined sugar and alcohol on a regular basis.
The other focus I have within my health goals is to improve my capoeira skills and flexibility. From years of ignoring stretching (and likely genetics) my body has become extremely stiff. So practicing capoeira helps out significantly but I also need to add on a layer stretching on my own time to see real improvements. My goal is within the next 3-5 years to be able to do a full split. It’s a distant, distant, distant dream right now but you’ve got to start somewhere, right?
Productivity

This is one of the categories that I think is really helpful. The data comes from RescueTime which is an application that collects data from my online and offline activities. With so much data pouring through everyday it gives me a good idea on what my productivity baselines are.
My average Productivity Pulse is around 77. So anything over that in a workday is good to aim for. The difference between Total Work Time and Productive Time is interesting too. Although I may work an average of 6.2 hours per day, my productive time is 4.57 hours per day. That means that there are certain activities or hours that really drive the productivity of my day. So making sure I take advantage of that time is crucial in making sure I get the most out of my day.
In Q2, I’ve been experimenting with a new tool called The Productivity Planner that helps me map out the most important task to get done everyday and use the Pomodoro Method to get it done. It’s already paid big dividends for me and I’m excited to see what the aggregate impact for Q2 will look like.
Learnings from Q1
- Continue to track consistently in Q2. Leverage the law of large numbers to identify baselines and trends.
- Monitor my 6:00 AM wake-up routine closely. See if I continue to get the best version out of myself with an early wake-up time.
- Experiment with a different time for my research/writing for my blog. Evening writing could work out better.
- Think about what a 4 out of 4 day looks like for investing in my friendships and relationship with Carly. What about days when nothing “special” happens?
- Look closer at my productivity time on RescueTime. Do the criterias look good? Should they be updated based on my activity?
To-do list for Q2
- Continue to implement the Productivity Planner for better strategizing and planning my workdays.
- Create a criteria for what a 4 out of 4 day looks like for each of the Daily Questions.
